Step 1: Critique
(not “criticism”)
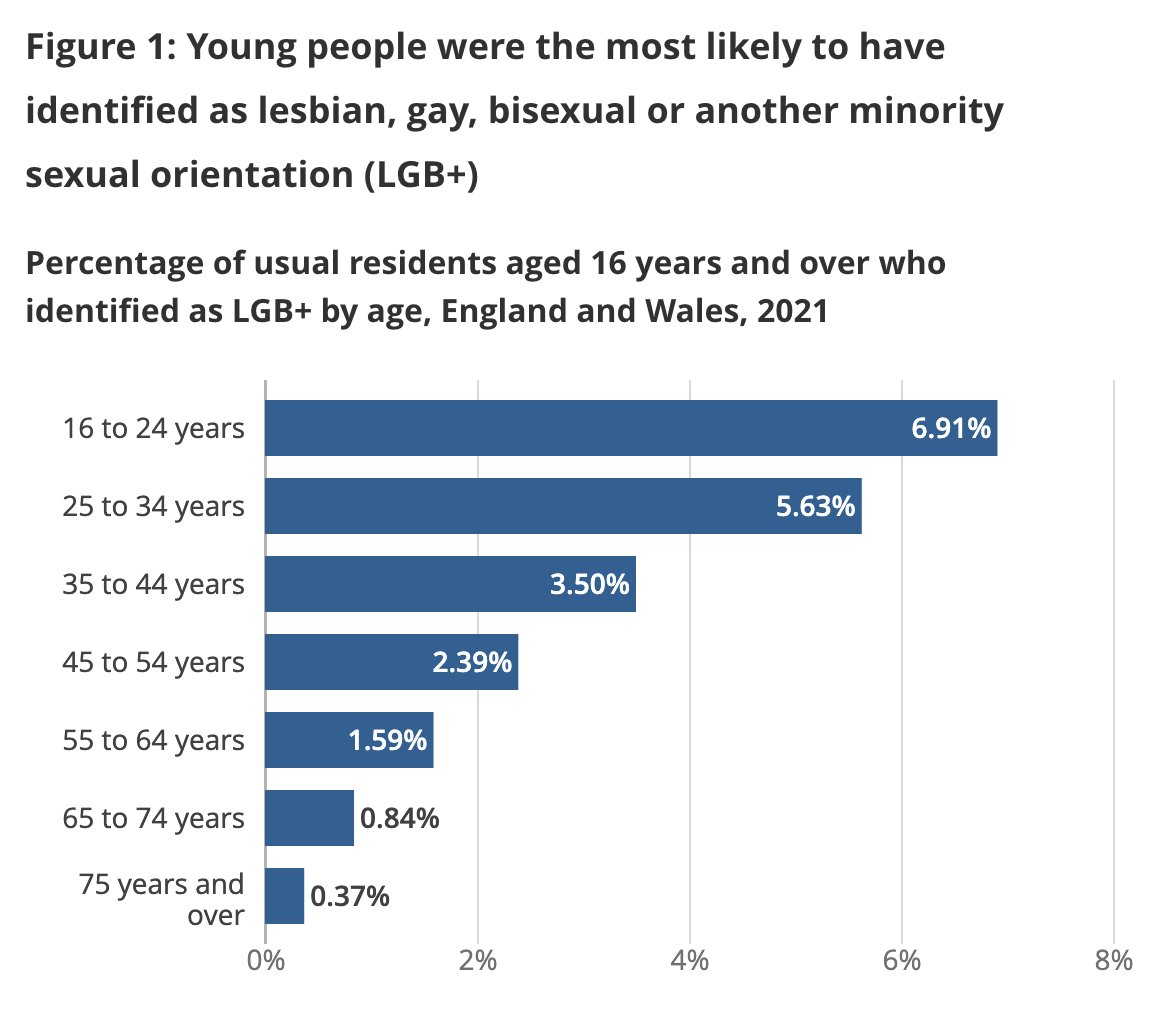
Source: Office for National Statistics (ONS) (2023)
Notes for discussion
How does the mapping of data to position aesthetics correspond to spatial metaphors?
What decisions were made, and what do we think of them?
Take special note of the text that’s been included.
Step 2: Attempted Re-creation
After loading the tidyverse, you should be able to copy-paste the code in the chunk below to have a dataframe of the dataframe represented in the graph that we can plot in ggplot2. The geometry to use here will be ggplot2::geom_col().
References
Office for National Statistics (ONS). 2023. “Sexual Orientation: Age and Sex, England and Wales: Census 2021.” https://www.ons.gov.uk/peoplepopulationandcommunity/culturalidentity/sexuality/articles/sexualorientationageandsexenglandandwales/census2021.