── Attaching packages ─────────────────────────────────────── tidyverse 1.3.2 ──
✔ tibble  3.1.8      ✔ dplyr   1.0.10
✔ tidyr   1.2.1      ✔ stringr 1.5.0
✔ readr   2.1.3      ✔ forcats 0.5.2
✔ purrr   0.3.5
── Conflicts ────────────────────────────────────────── tidyverse_conflicts() ──
✖ dplyr::filter() masks stats::filter()
✖ dplyr::lag() masks stats::lag()Some sample datasets
Nasapower
This packages lets us grab
https://docs.ropensci.org/nasapower/
daily_ag <- get_power(community = "ag",
                      lonlat = c(-84.501640,38.047989),
                      pars = c("RH2M", "T2M", "PRECTOTCORR"),
                      dates = c("1983-01-01", "2021-12-31"),
                      temporal_api = "daily"
                      )
daily_ag |> tail()
NASA/POWER CERES/MERRA2 Native Resolution Daily Data
Dates (month/day/year): 01/01/1983 through 12/31/2021
Location: Latitude 38.048 Longitude -84.5016
Elevation from MERRA-2: Average for 0.5 x 0.625 degree lat/lon region = 280.65 meters
The value for missing source data that cannot be computed or is outside of the sources availability range: NA
Parameter(s):
Parameters:
RH2M MERRA-2 Relative Humidity at 2 Meters (%) ;
T2M MERRA-2 Temperature at 2 Meters (C) ;
PRECTOTCORR MERRA-2 Precipitation Corrected (mm/day)
# A tibble: 6 × 10
LON LAT YEAR MM DD DOY YYYYMMDD RH2M T2M PRECTOTCORR
<dbl> <dbl> <dbl> <int> <int> <int> <date> <dbl> <dbl> <dbl>
1 -84.5 38.0 2021 12 26 360 2021-12-26 89.4 9.36 0.04
2 -84.5 38.0 2021 12 27 361 2021-12-27 92.1 15.1 2.48
3 -84.5 38.0 2021 12 28 362 2021-12-28 89.6 12.5 7.45
4 -84.5 38.0 2021 12 29 363 2021-12-29 88.3 11.5 3.38
5 -84.5 38.0 2021 12 30 364 2021-12-30 96.1 8.63 0.23
6 -84.5 38.0 2021 12 31 365 2021-12-31 92.1 13.0 4.08Walkability scores
https://catalog.data.gov/dataset/walkability-index
wakability <- read_csv("https://edg.epa.gov/EPADataCommons/public/OA/EPA_SmartLocationDatabase_V3_Jan_2021_Final.csv")Rows: 220740 Columns: 117
── Column specification ────────────────────────────────────────────────────────
Delimiter: ","
chr (2): CSA_Name, CBSA_Name
dbl (115): OBJECTID, GEOID10, GEOID20, STATEFP, COUNTYFP, TRACTCE, BLKGRPCE,...
ℹ Use `spec()` to retrieve the full column specification for this data.
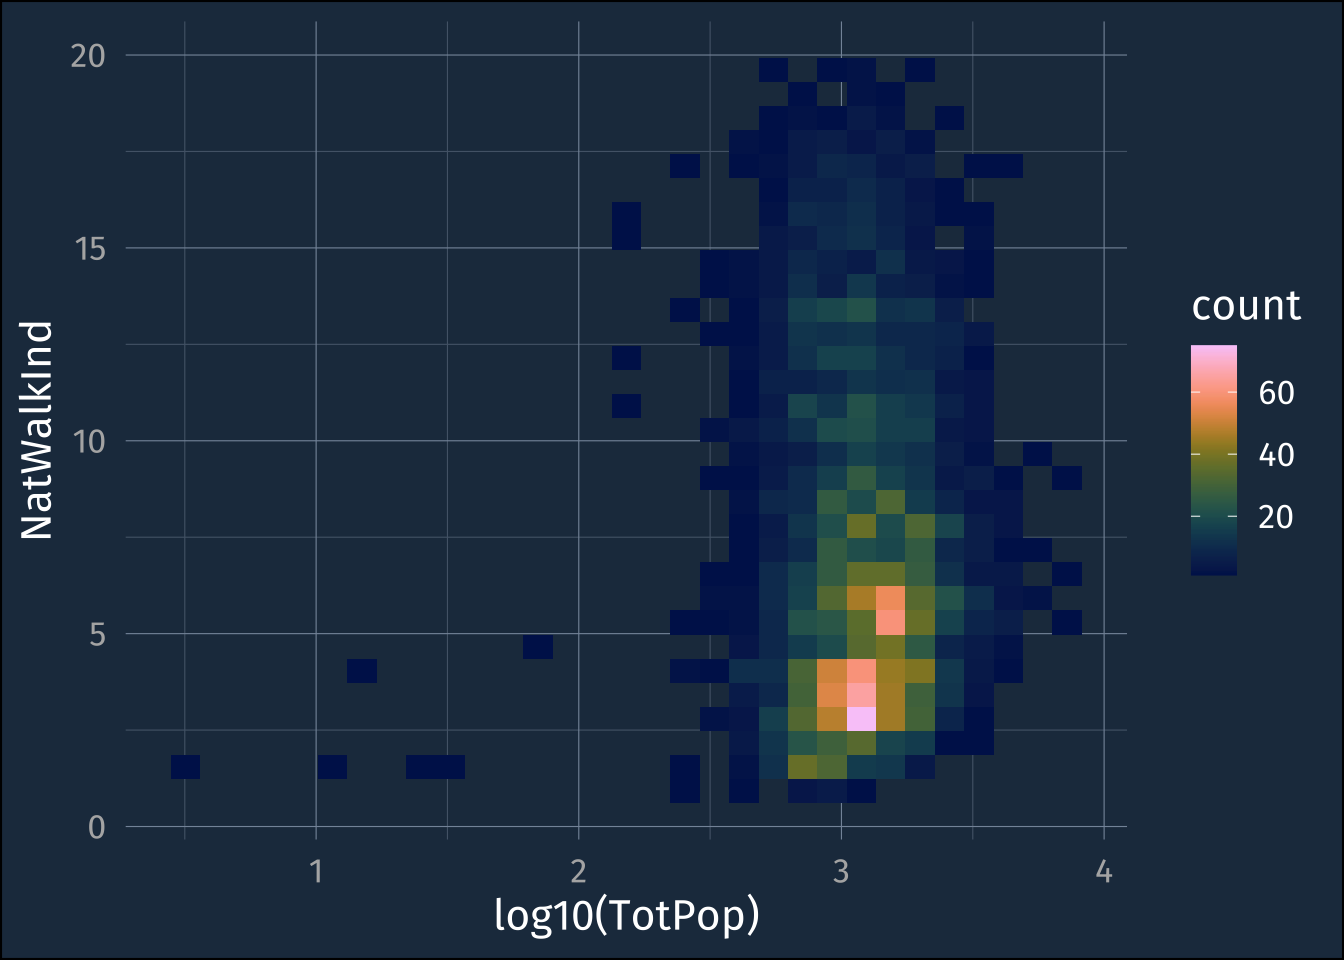
ℹ Specify the column types or set `show_col_types = FALSE` to quiet this message.wakability |>
filter(STATEFP == 21) |>
ggplot(aes(log10(TotPop), NatWalkInd))+
stat_bin_2d()+
scale_fill_batlow()Warning: Removed 8 rows containing non-finite values (`stat_bin2d()`).