Code
library(tidyverse)
library(patchwork)
library(tidybayes)
library(ggdist)
library(here)

source(here("_defaults.R"))library(tidyverse)
library(patchwork)
library(tidybayes)
library(ggdist)
library(here)
source(here("_defaults.R"))tibble(
p = seq(0, 1, length = 1000),
dens = dbeta(p, 6+1, 3+1),
posterior = dens/sum(dens)
) ->
posterior_gridposterior_grid |>
ggplot(aes(p, posterior))+
geom_area(fill = ptol_blue, color = "black")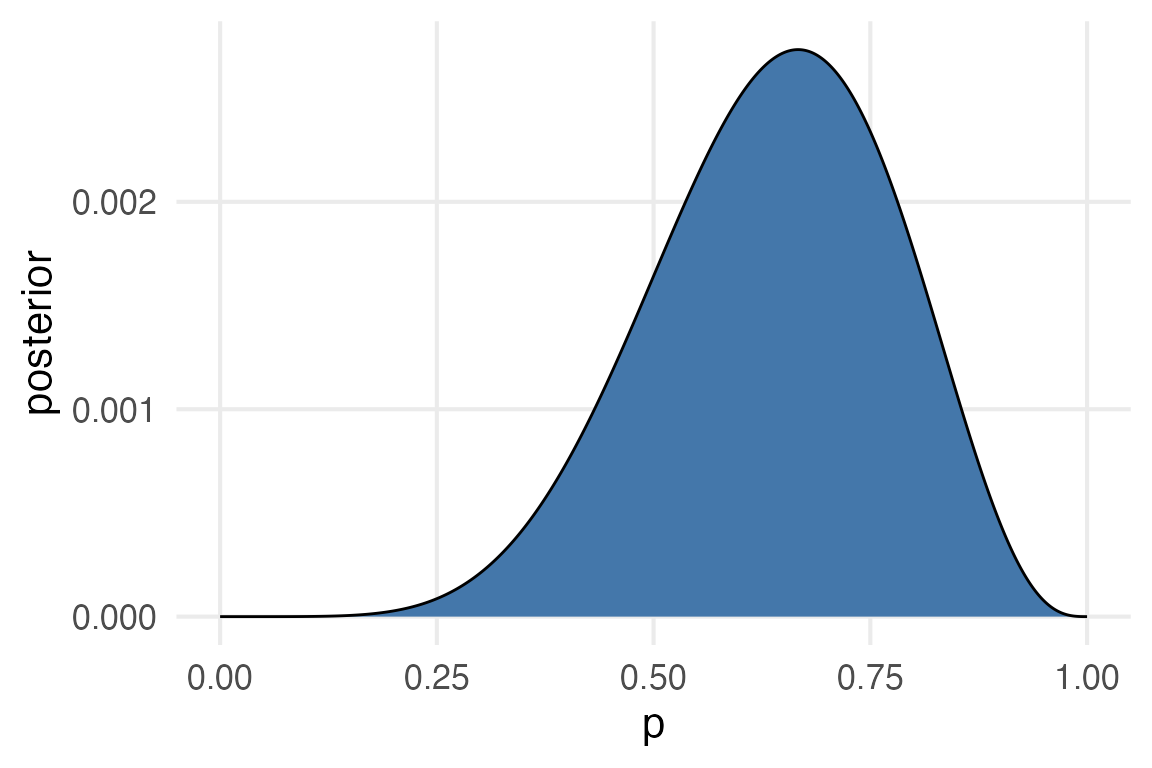
posterior_grid |>
  sample_n(
    size = 1e4,
    replace = T,
    weight = posterior
  )->
  posterior_samples
This isn’t MCMC sampling, but I’ll plot it as a line just for consistency for how MCMC chains look.
posterior_samples |>
  mutate(
    sample = row_number()
  ) |>
  ggplot(aes(sample, p))+
    geom_line()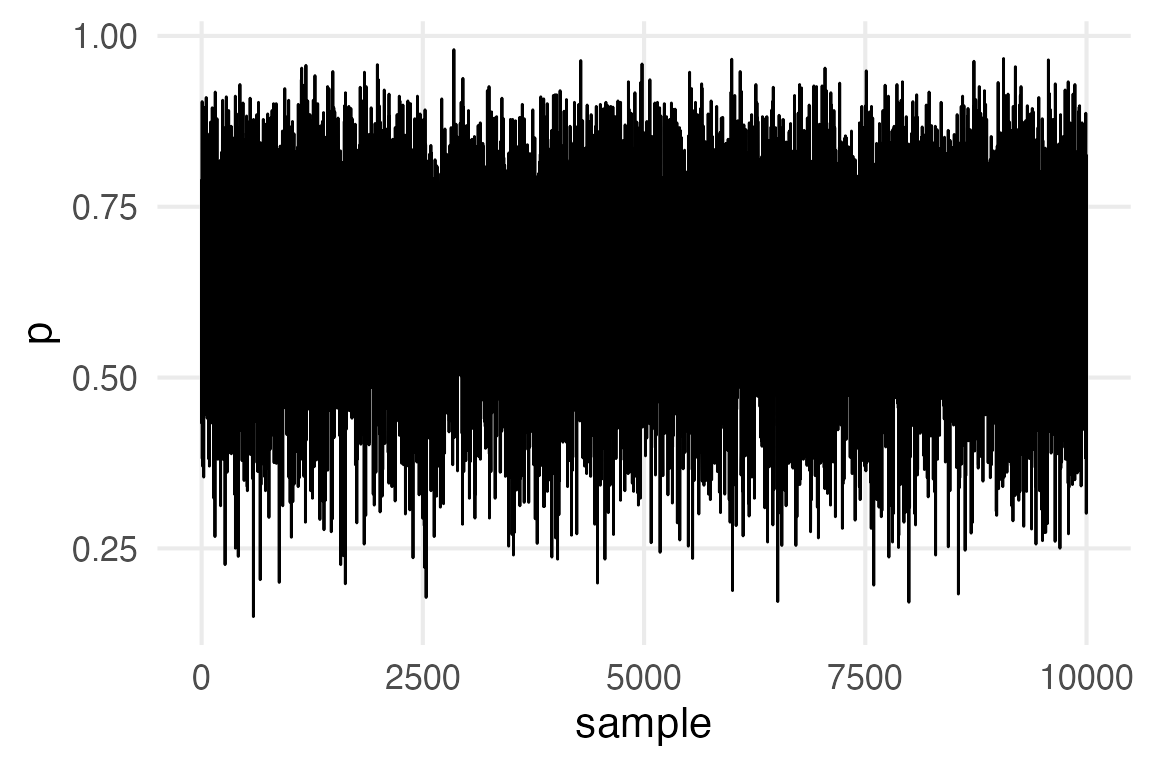
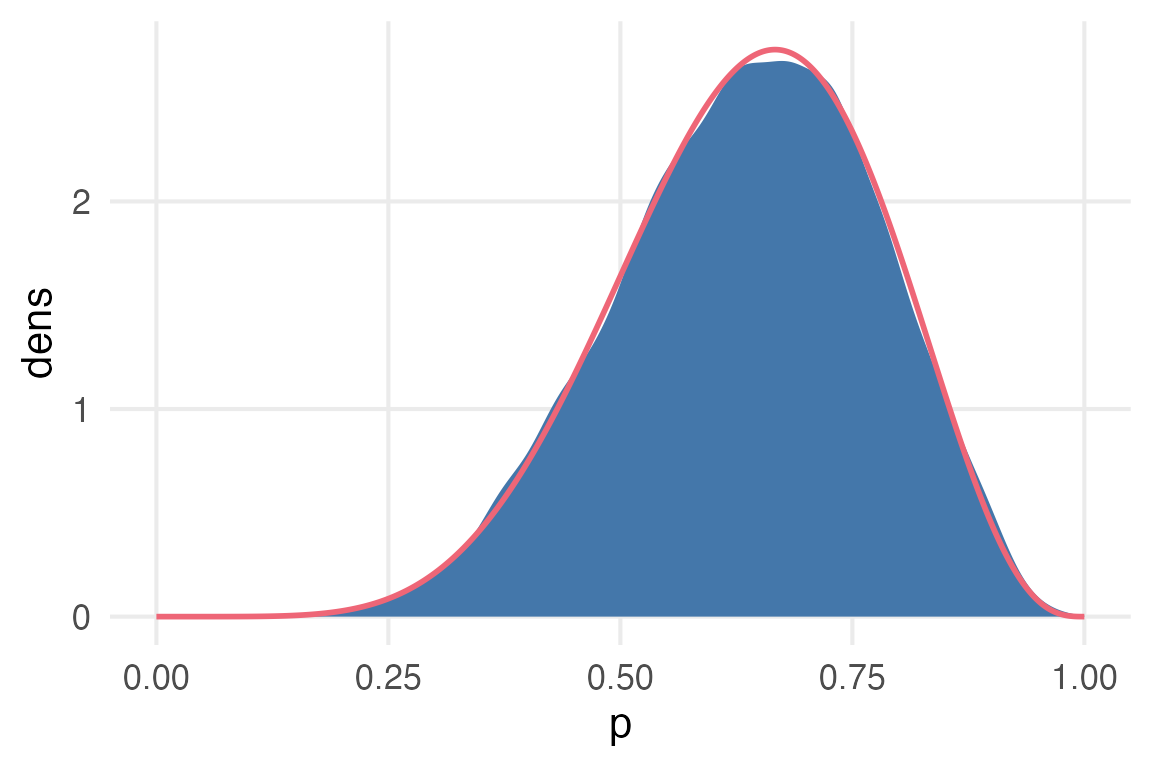
Comparing to the sampling to the original density function.
posterior_samples |>
  ggplot(aes(p))+
    stat_density(
      fill = ptol_blue
      ) +
    geom_line(
      data = posterior_grid,
      aes(y = dens),
      color = ptol_red,
      linewidth = 1
    )
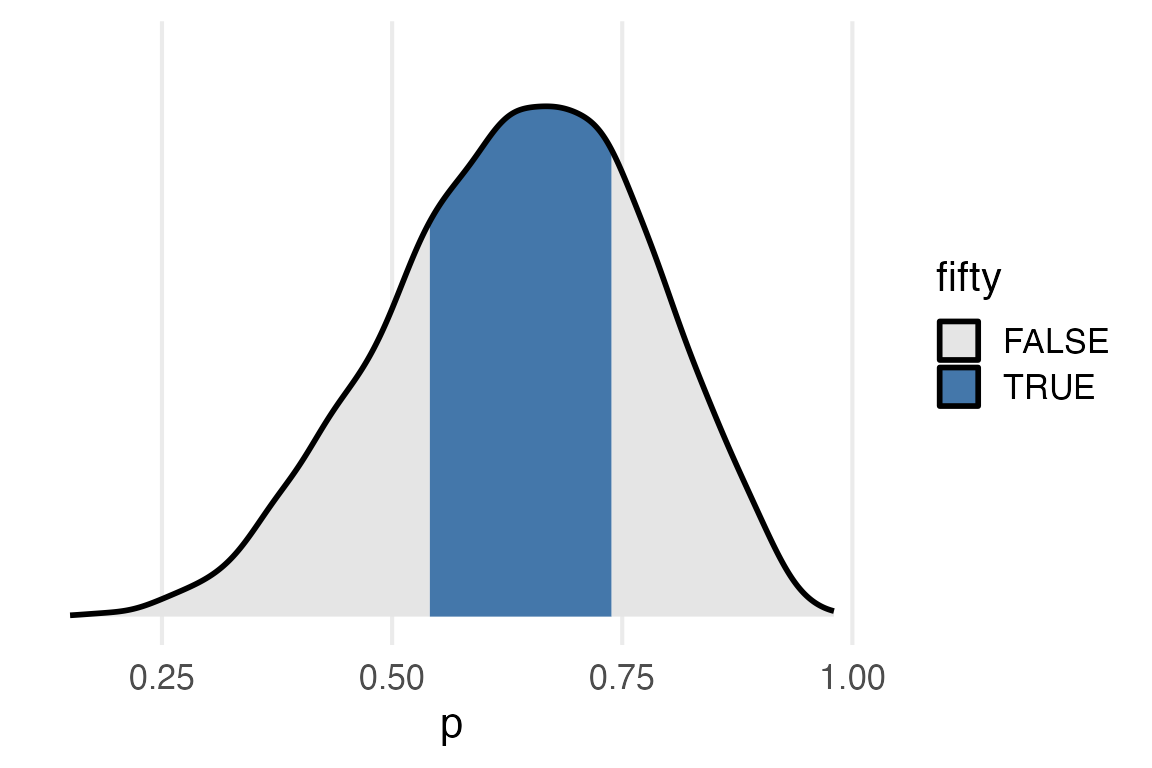
First manually
posterior_samples |>
  reframe(
    lowhi = quantile(p, probs = c(0.25, 0.75))
  ) |>
  pull(lowhi)->
  fifty_quantile
posterior_samples |>
ggplot(aes(p))+
ggdist::stat_slab(
color = "black",
aes(
fill = after_stat(
x >= fifty_quantile[1] & x <= fifty_quantile[2]
)
)
)+
labs(
fill = "fifty",
y = NULL
)+
scale_fill_manual(
values = c("grey90", ptol_blue)
)+
theme(
axis.text.y = element_blank(),
panel.grid.major.y = element_blank()
)
I think I’ll create a shortcut theme for having no y axis.
theme_no_y <- function(){
  theme(
      axis.text.y = element_blank(),
      axis.title.y = element_blank(),
      panel.grid.major.y = element_blank()
    )
}
posterior_samples |>
ggplot(aes(p))+
stat_slab() +
theme_no_y()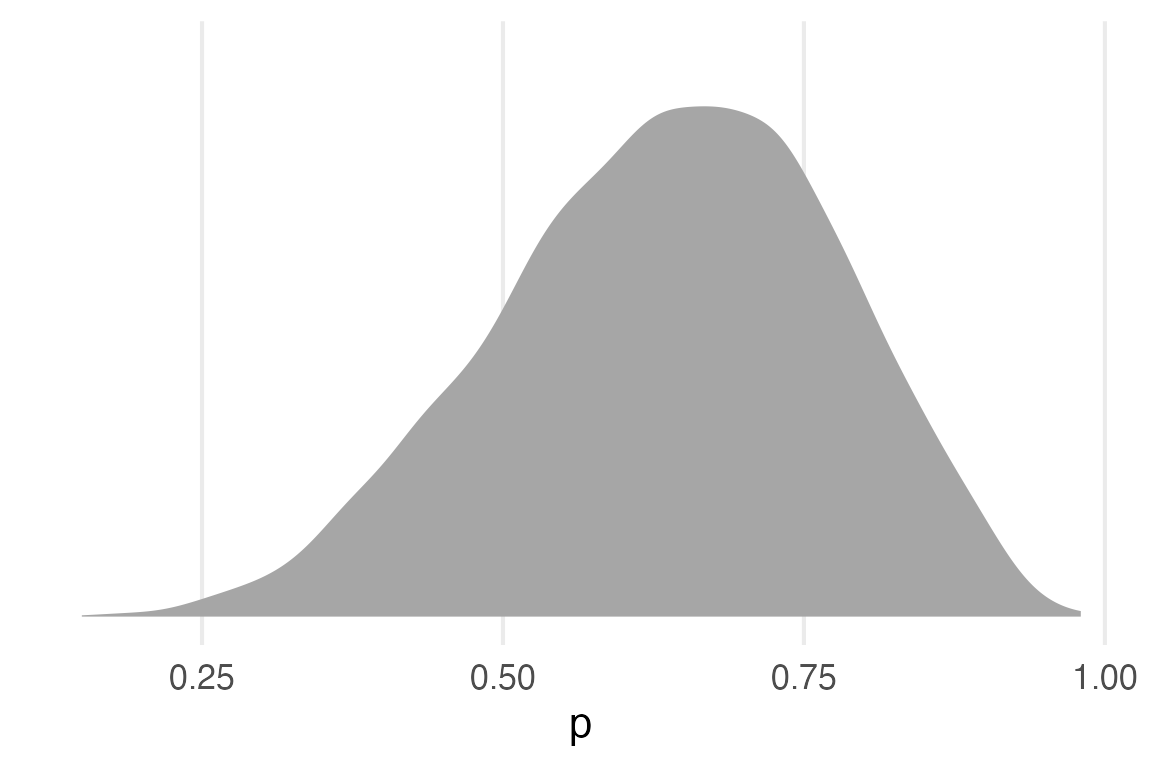
I’m not 100% sure how all of the tidybayes functions work.
posterior_samples |>
  summarise(
    median_qi(p, .width = 0.5)
  )
# A tibble: 1 × 6
y ymin ymax .width .point .interval
<dbl> <dbl> <dbl> <dbl> <chr> <chr>
1 0.644 0.542 0.738 0.5 median qi posterior_samples |>
reframe(
quantile = quantile(p, probs = c(0.25, 0.5, 0.75))
)# A tibble: 3 × 1
quantile
<dbl>
1 0.542
2 0.644
3 0.738Ok, *_qi() returns the quantile interval.
I’d like to make the plot according to the statistics calculated by stat_halfeye(), but can’t seem to get it to work.
posterior_samples |>
  ggplot(aes(p))+
    stat_halfeye(
      .width = 0.5,
      aes(
        fill = after_stat(x > xmin)
      )
    )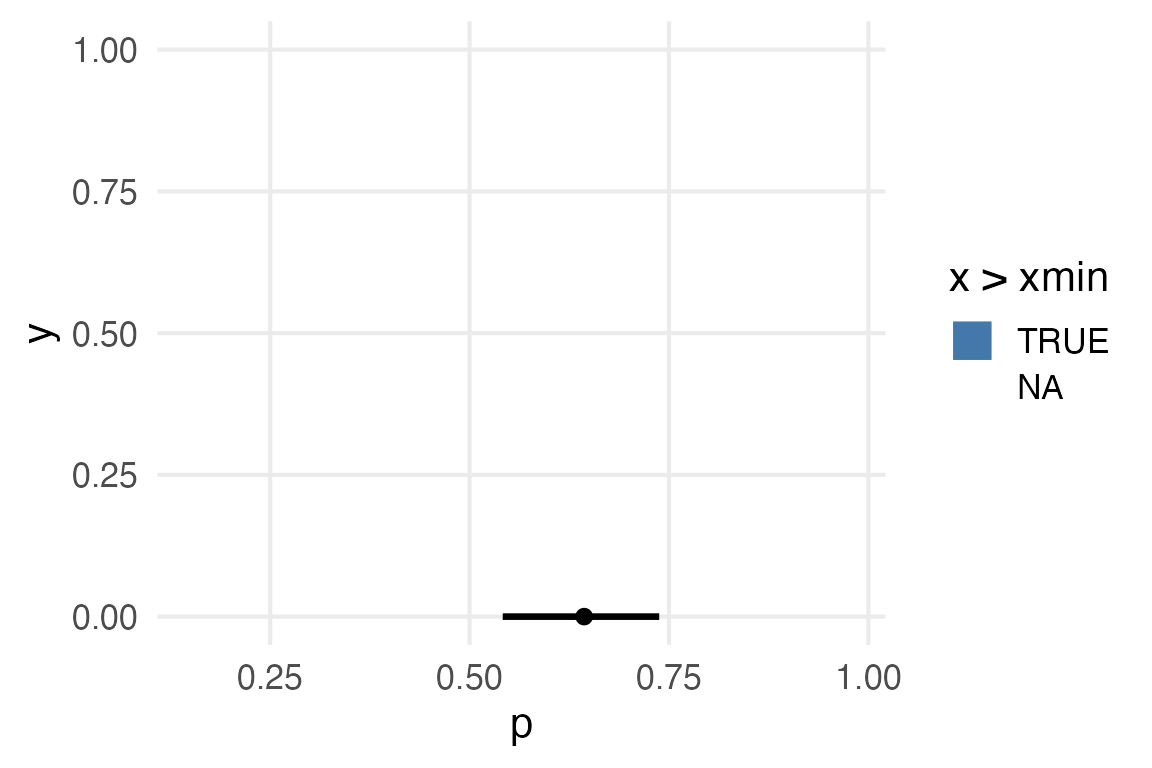
I’ll just do the same filling I did before.
posterior_samples |>
  ggplot(aes(p))+
    stat_halfeye(
      .width = 0.5,
      point_interval = median_qi,
      slab_color = "black",
      aes(
        fill = after_stat(
          x >= fifty_quantile[1] & x <= fifty_quantile[2]
        )
      )
    )+
  scale_fill_manual(
      values = c("grey90", ptol_blue)
    )+
  labs(fill = "fifty")+
  theme_no_y()->
  fifty_qi
fifty_qi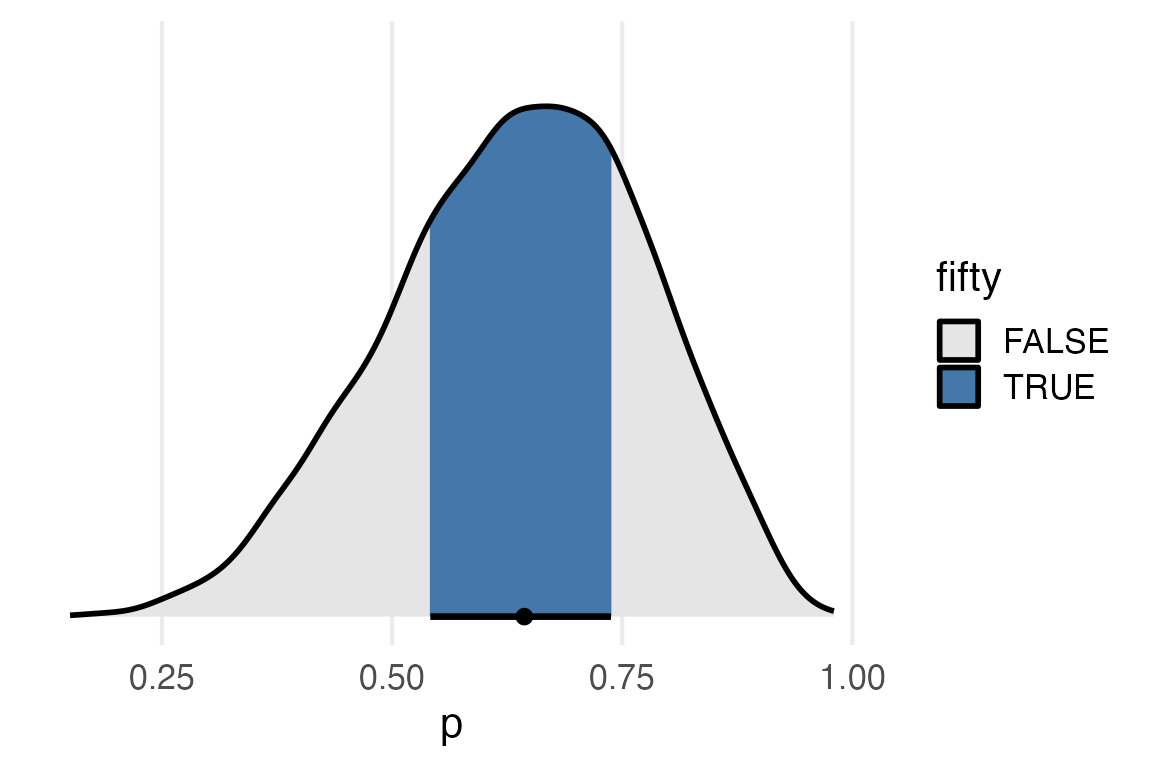
Lemme try hpdi now.
posterior_samples |>
  summarise(
    mean_hdi(p, .width = 0.5)
  )->
  posterior_hdi
posterior_samples |>
ggplot(aes(p))+
stat_halfeye(
.width = 0.5,
point_interval = median_hdi,
slab_color = "black",
aes(
fill = after_stat(
x >= posterior_hdi$ymin &
x <= posterior_hdi$ymax
)
)
)+
scale_fill_manual(
values = c("grey90", ptol_blue)
)+
labs(fill = "fifty")+
theme_no_y()->
fifty_hdi
fifty_hdi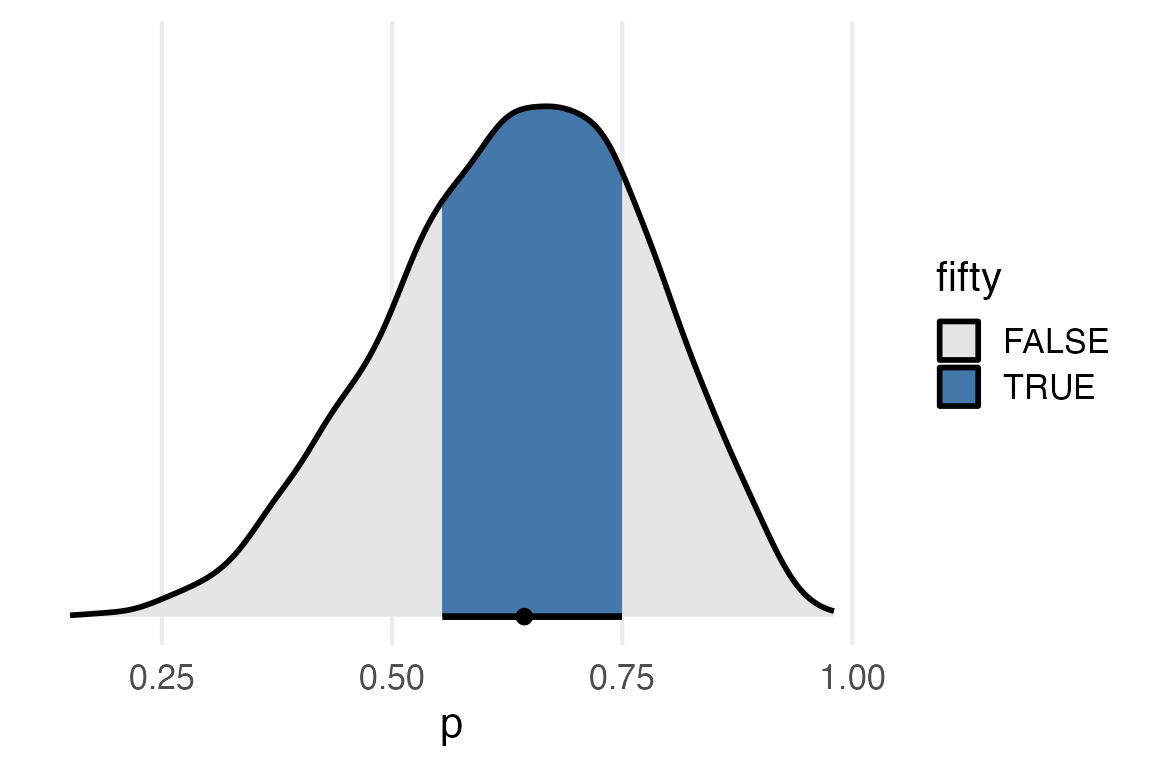
fifty_qi/fifty_hdi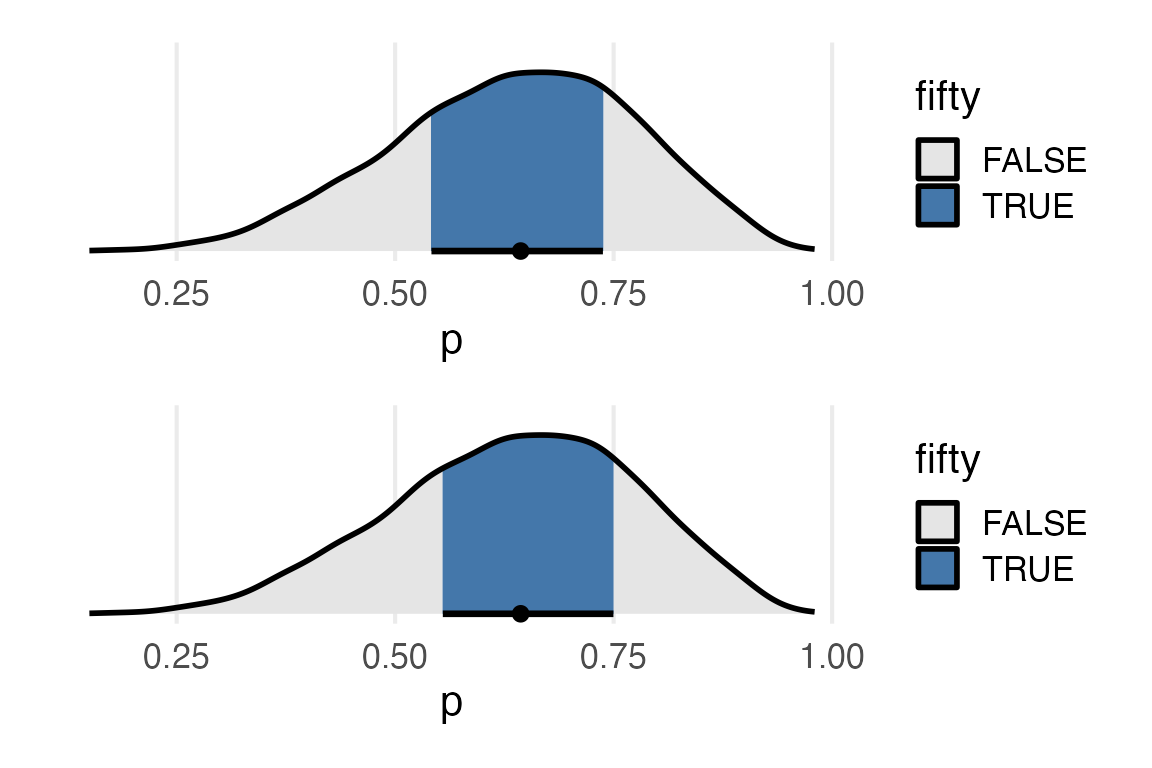
They’re very similar, but if I mix the qi fill and the hdi interval, they’re different.
posterior_samples |>
  ggplot(aes(p))+
    stat_halfeye(
      .width = 0.5,
      point_interval = median_hdi,
      slab_color = "black",
      aes(
        fill = after_stat(
         x >= fifty_quantile[1] & x <= fifty_quantile[2]
        )
      )
    )+
  scale_fill_manual(
      values = c("grey90", ptol_blue)
    )+
  labs(fill = "fifty")+
  theme_no_y()