Watt and Fabricius DCT normalization
Usage
norm_dct_wattfab(
  .data,
  ...,
  .token_id_col,
  .by = NULL,
  .param_col = NULL,
  .drop_orig = FALSE,
  .names = "{.formant}_wf",
  .silent = FALSE
)
Arguments
- .data
A data frame containing vowel formant data
- ...
<tidy-select>One or more unquoted expressions separated by commas. These should target the vowel formant data columns.- .token_id_col
<data-masking>A column that identifies token ids.- .by
<tidy-select>A selection of columns to group by. Typically a column of speaker IDs.- .param_col
A column identifying the DCT parameter number.
- .drop_orig
Should the originally targeted columns be dropped.
- .names
A
glue::glue()expression for naming the normalized data columns. The"{.formant}"portion corresponds to the name of the original formant columns.- .silent
Whether or not the informational message should be printed.
Details
This is a modified version of the Watt & Fabricius Method. The original method identified point vowels over which F1 and F2 centroids were calculated. The procedure here just identifies centroids by taking the mean of all formant values.
$$ \hat{F}_{ij} = \frac{F_{ij}}{S_i} $$
$$ S_i = \frac{1}{N}\sum_{j=1}^N F_{ij} $$
Where
\(\hat{F}\) is the normalized formant
\(i\) is the formant number
\(j\) is the token number
References
Watt, D., & Fabricius, A. (2002). Evaluation of a technique for improving the mapping of multiple speakers’ vowel spaces in the F1 ~ F2 plane. Leeds Working Papers in Linguistics and Phonetics, 9, 159–173.
Examples
library(tidynorm)
library(dplyr)
ggplot2_inst <- require(ggplot2)
speaker_dct <- speaker_tracks |>
reframe_with_dct(
F1:F3,
.by = speaker,
.token_id_col = id,
.time_col = t
)
# Normalize DCT coefficients
speaker_dct_norm <- speaker_dct |>
norm_dct_wattfab(
F1:F3,
.by = speaker,
.token_id_col = id,
.param_col = .param
)
#> Normalization info
#> • normalized with `tidynorm::norm_dct_wattfab()`
#> • normalized `F1`, `F2`, and `F3`
#> • normalized values in `F1_wf`, `F2_wf`, and `F3_wf`
#> • token id column: `id`
#> • DCT parameter column: `.param`
#> • grouped by `speaker`
#> • within formant: TRUE
#> • (.formant - 0)/mean(.formant, na.rm = T)
#>
# Apply average and apply inverse dct
# to plot tracks
track_norm_means <- speaker_dct_norm |>
summarise(
.by = c(speaker, vowel, .param),
across(
ends_with("_wf"),
mean
)
) |>
reframe_with_idct(
ends_with("_wf"),
.by = speaker,
.token_id_col = vowel,
.param_col = .param
)
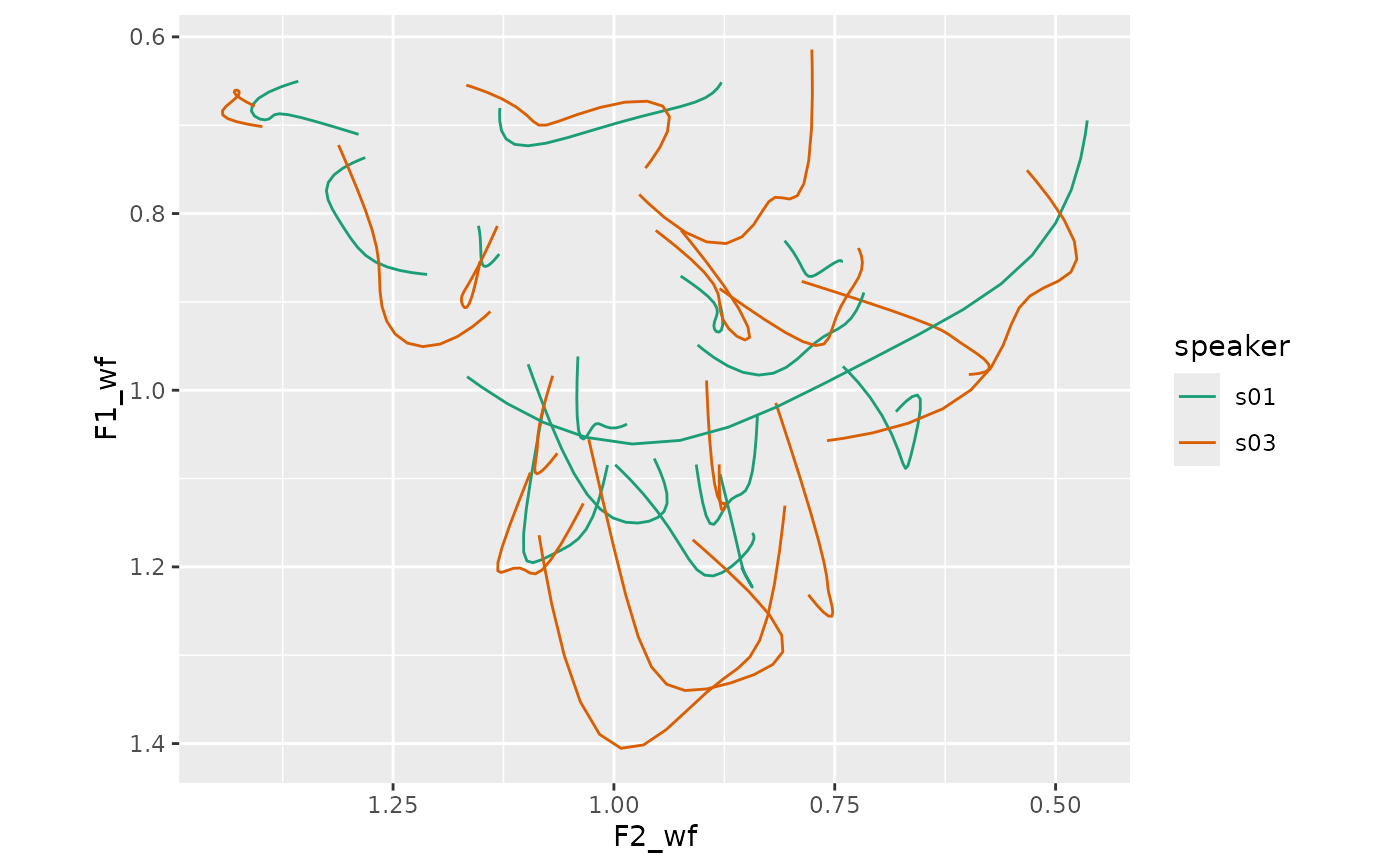
if (ggplot2_inst) {
track_norm_means |>
ggplot(
aes(F2_wf, F1_wf, color = speaker)
) +
geom_path(
aes(
group = interaction(speaker, vowel)
)
) +
scale_x_reverse() +
scale_y_reverse() +
scale_color_brewer(palette = "Dark2") +
coord_fixed()
}