Reframe data columns using the Inverse Discrete Cosine Transform
Usage
reframe_with_idct(
  .data,
  ...,
  .token_id_col = NULL,
  .by = NULL,
  .param_col = NULL,
  .n = 20,
  .rate = FALSE,
  .accel = FALSE
)
Arguments
- .data
A data frame
- ...
<tidy-select>One or more unquoted expressions separated by commas. These should target the vowel formant.- .token_id_col
<tidy-select>The token ID column.- .by
<tidy-select>A grouping column.- .param_col
A column identifying the DCT parameter number
- .n
The size of the outcome of the IDCT
- .rate
Whether or not to include the rate of change of signal.
- .accel
Whether or not to include acceleration of signal.
Value
A data frame with the IDCT of the targeted columns along with an
additional .time column.
- .time
A column from 1 to
.nby token
Details
This will apply the Inverse Discrete Cosine Transform to the targeted columns. See idct.
Identifying tokens
The IDCT only works on a by-token basis, so there must be a column that
uniquely identifies (or, in combination with a .by grouping, uniquely
identifies) each individual token. This column should be passed to
.token_id_col.
Examples
library(tidynorm)
library(dplyr)
ggplot2_inst <- require(ggplot2)

speaker_small <- filter(
  speaker_tracks,
  id == 0
)

speaker_dct <- speaker_small |>
  reframe_with_dct(
    F1:F3,
    .by = speaker,
    .token_id_col = id,
    .time_col = t,
    .order = 5
  )

speaker_idct <- speaker_dct |>
  reframe_with_idct(
    F1:F3,
    .by = speaker,
    .token_id_col = id,
    .param_col = .param,
    .n = 20
  )

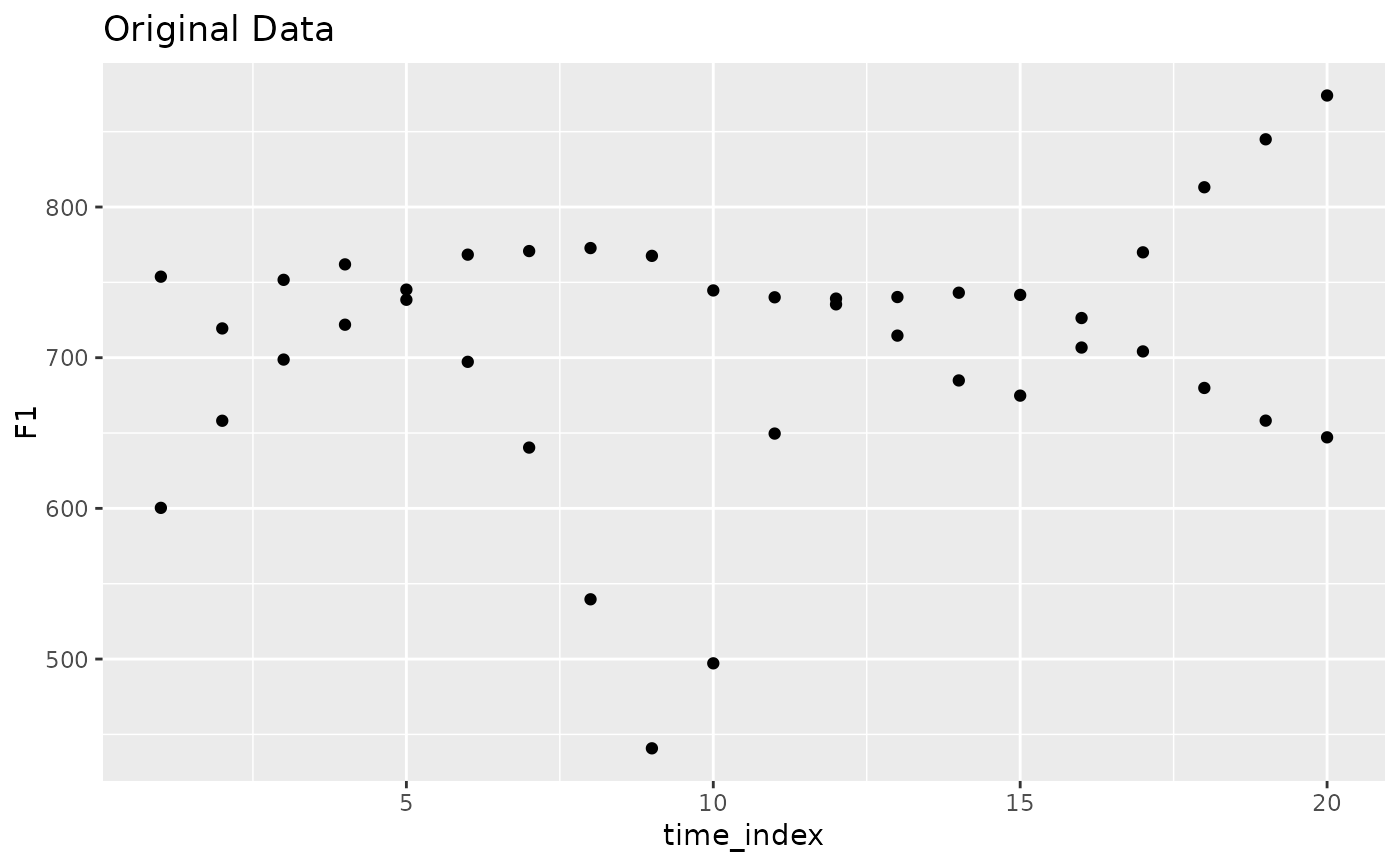
if (ggplot2_inst) {
  speaker_small |>
    mutate(
      .by = c(speaker, id),
      time_index = row_number()
    ) |>
    ggplot(
      aes(
        time_index, F1
      )
    ) +
    geom_point() +
    labs(
      title = "Original Data"
    )
}


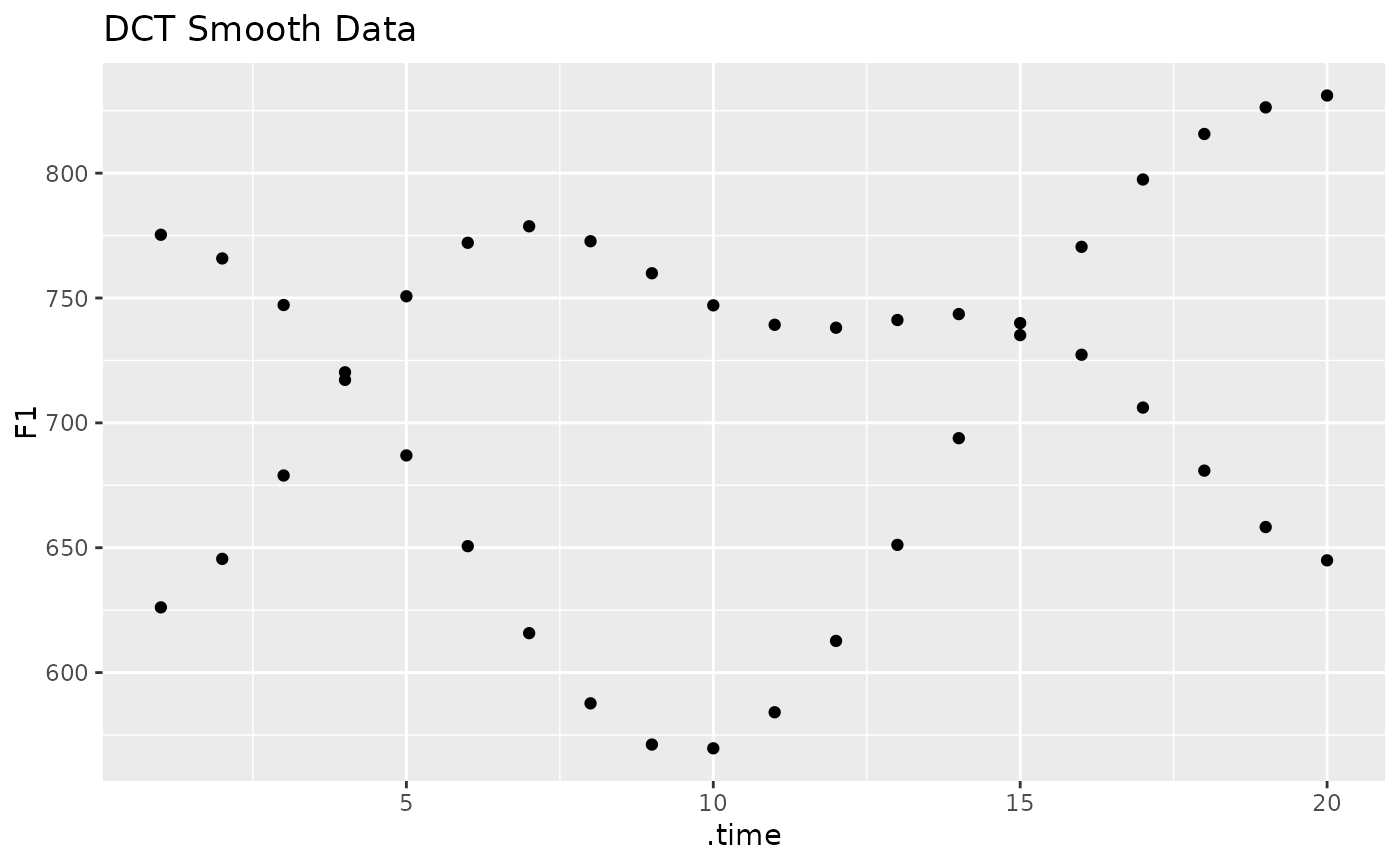
if (ggplot2_inst) {
  speaker_idct |>
    ggplot(
      aes(
        .time, F1
      )
    ) +
    geom_point() +
    labs(
      title = "DCT Smooth Data"
    )
}

