Lobanov DCT Normalization
Usage
norm_dct_lobanov(
  .data,
  ...,
  .token_id_col,
  .by = NULL,
  .param_col = NULL,
  .names = "{.formant}_z",
  .silent = FALSE,
  .drop_orig = FALSE
)
Arguments
- .data
A data frame of formant DCT coefficients
- ...
<tidy-select>One or more unquoted expressions separated by commas. These should target the vowel formant data columns.- .token_id_col
<data-masking>A column that identifies token ids.- .by
<tidy-select>A selection of columns to group by. Typically a column of speaker IDs.- .param_col
A column identifying the DCT parameter number.
- .names
A
glue::glue()expression for naming the normalized data columns. The"{.formant}"portion corresponds to the name of the original formant columns.- .silent
Whether or not the informational message should be printed.
- .drop_orig
Should the originally targeted columns be dropped.
Details
$$ \hat{F}_{ij} = \frac{F_{ij} - L_i}{S_i} $$
$$ L_i = \frac{1}{N}\sum_{j=1}^{N}F_{ij} $$
$$ S_i = \sqrt{\frac{\sum(F_{ij}-L_i)^2}{N-1}} $$
Where
\(\hat{F}\) is the normalized formant
\(i\) is the formant number
\(j\) is the token number
References
Lobanov, B. (1971). Classification of Russian vowels spoken by different listeners. Journal of the Acoustical Society of America, 49, 606–608.
Examples
library(tidynorm)
library(dplyr)
ggplot2_inst <- require(ggplot2)
speaker_dct <- speaker_tracks |>
reframe_with_dct(
F1:F3,
.by = speaker,
.token_id_col = id,
.time_col = t
)
# Normalize DCT coefficients
speaker_dct_norm <- speaker_dct |>
norm_dct_lobanov(
F1:F3,
.by = speaker,
.token_id_col = id,
.param_col = .param
)
#> Normalization info
#> • normalized with `tidynorm::norm_dct_lobanov()`
#> • normalized `F1`, `F2`, and `F3`
#> • normalized values in `F1_z`, `F2_z`, and `F3_z`
#> • token id column: `id`
#> • DCT parameter column: `.param`
#> • grouped by `speaker`
#> • within formant: TRUE
#> • (.formant - mean(.formant, na.rm = T))/sd(.formant, na.rm = T)
#>
# Apply average and apply inverse dct
# to plot tracks
track_norm_means <- speaker_dct_norm |>
summarise(
.by = c(speaker, vowel, .param),
across(
ends_with("_z"),
mean
)
) |>
reframe_with_idct(
ends_with("_z"),
.by = speaker,
.token_id_col = vowel,
.param_col = .param
)
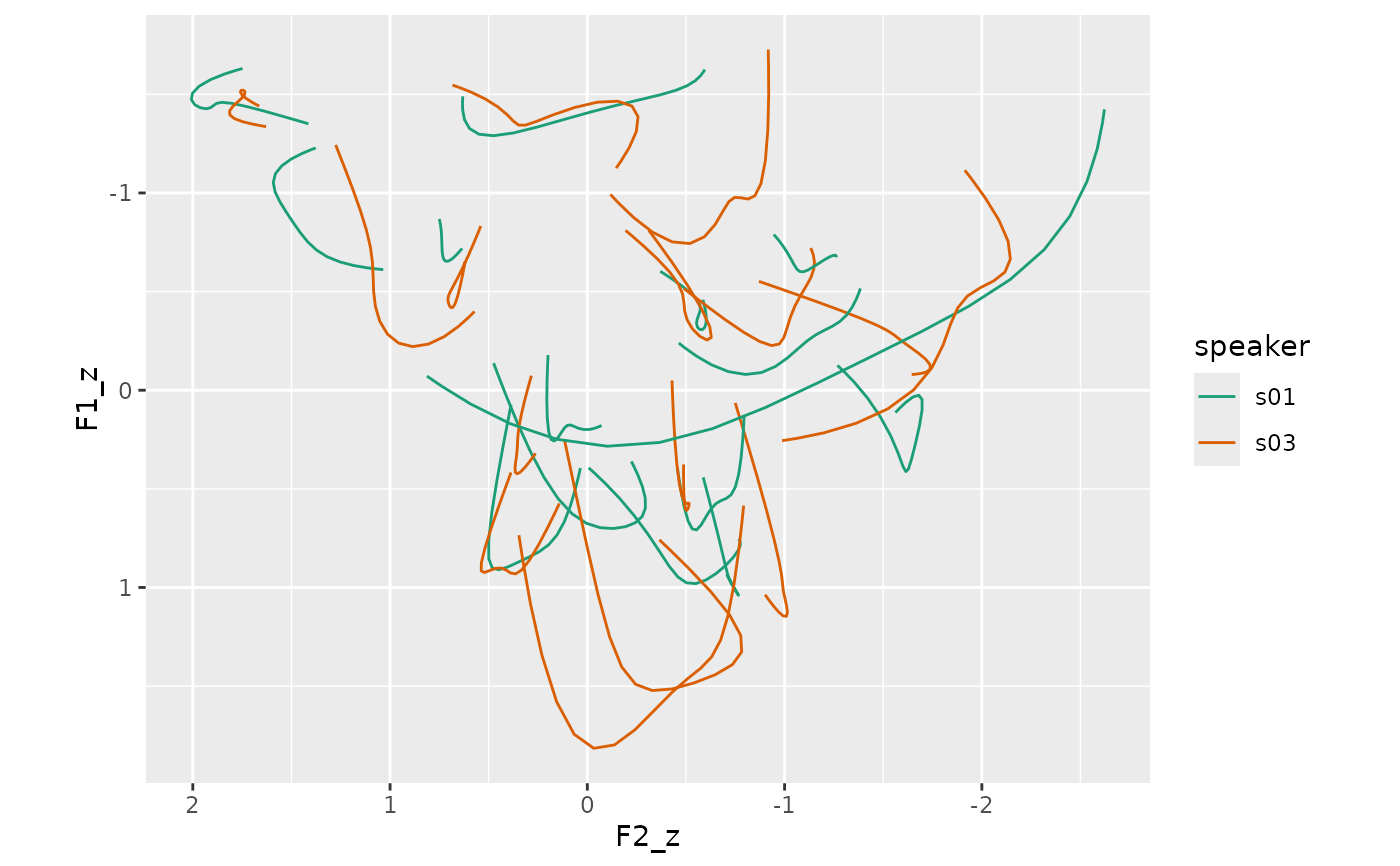
if (ggplot2_inst) {
track_norm_means |>
ggplot(
aes(F2_z, F1_z, color = speaker)
) +
geom_path(
aes(
group = interaction(speaker, vowel)
)
) +
scale_x_reverse() +
scale_y_reverse() +
scale_color_brewer(palette = "Dark2") +
coord_fixed()
}