Bark Difference DCT Normalization
Usage
norm_dct_barkz(
  .data,
  ...,
  .token_id_col,
  .by = NULL,
  .param_col = NULL,
  .drop_orig = FALSE,
  .names = "{.formant}_bz",
  .silent = FALSE
)
Arguments
- .data
A data frame containing vowel formant data
- ...
<tidy-select>One or more unquoted expressions separated by commas. These should target the vowel formant data columns.- .token_id_col
<data-masking>A column that identifies token ids.- .by
<tidy-select>A selection of columns to group by. Typically a column of speaker IDs.- .param_col
A column identifying the DCT parameter number.
- .drop_orig
Should the originally targeted columns be dropped.
- .names
A
glue::glue()expression for naming the normalized data columns. The"{.formant}"portion corresponds to the name of the original formant columns.- .silent
Whether or not the informational message should be printed.
Value
A data frame of normalized DCT parameters.
A data frame of Back Difference normalized dct coefficients.
Details
Important: This function assumes that the DCT coefficients were estimated over bark-transformed formant values.
This is a within-token normalization technique. First all formants are converted to Bark (see hz_to_bark), then, within each token, F3 is subtracted from F1 and F2.
$$ \hat{F}_{ij} = F_{ij} - L_j $$
$$ L_j = F_{3j} $$
References
Syrdal, A. K., & Gopal, H. S. (1986). A perceptual model of vowel recognition based on the auditory representation of American English vowels. The Journal of the Acoustical Society of America, 79(4), 1086–1100. doi:10.1121/1.393381
Examples
library(tidynorm)
library(dplyr)
#>
#> Attaching package: ‘dplyr’
#> The following objects are masked from ‘package:stats’:
#>
#> filter, lag
#> The following objects are masked from ‘package:base’:
#>
#> intersect, setdiff, setequal, union
ggplot2_inst <- require(ggplot2)
speaker_dct <- speaker_tracks |>
mutate(
across(F1:F3, hz_to_bark)
) |>
reframe_with_dct(
F1:F3,
.by = speaker,
.token_id_col = id,
.time_col = t
)
# Normalize DCT coefficients
speaker_dct_norm <- speaker_dct |>
norm_dct_barkz(
F1:F3,
.by = speaker,
.token_id_col = id,
.param_col = .param
)
#> Normalization info
#> • normalized with `tidynorm::norm_dct_barkz()`
#> • normalized `F1`, `F2`, and `F3`
#> • `F3` used for third formant.
#> • normalized values in `F1_bz`, `F2_bz`, and `F3_bz`
#> • token id column: `id`
#> • DCT parameter column: `.param`
#> • grouped by `speaker`
#> • within formant: FALSE
#> • within token: TRUE
#> • (.formant - .formant[3])/(1/sqrt(2))
#>
# Apply average and apply inverse dct
# to plot tracks
track_norm_means <- speaker_dct_norm |>
summarise(
.by = c(speaker, vowel, .param),
across(
ends_with("_bz"),
mean
)
) |>
reframe_with_idct(
ends_with("_bz"),
.by = speaker,
.token_id_col = vowel,
.param_col = .param
)
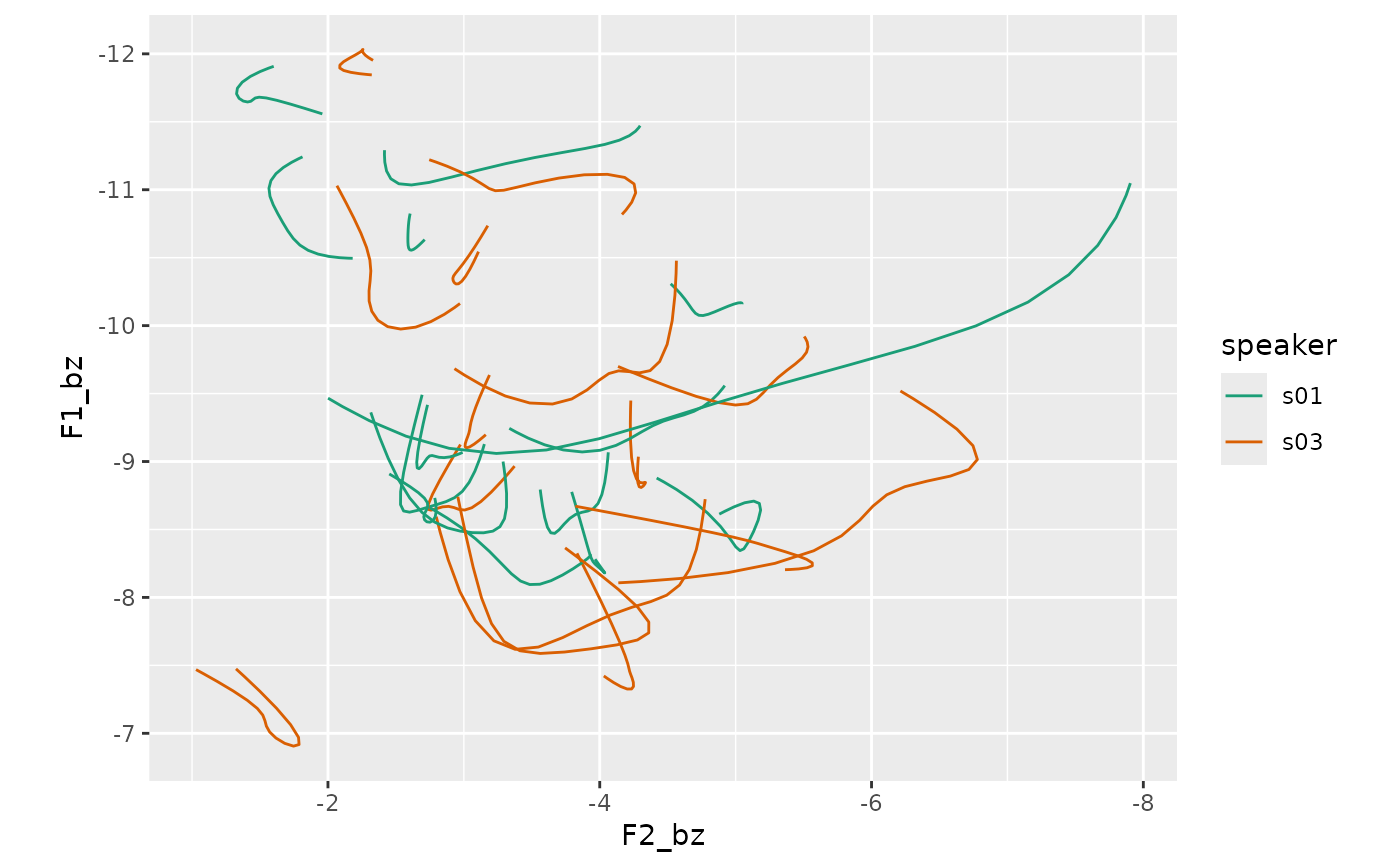
if (ggplot2_inst) {
track_norm_means |>
ggplot(
aes(F2_bz, F1_bz, color = speaker)
) +
geom_path(
aes(
group = interaction(speaker, vowel)
)
) +
scale_x_reverse() +
scale_y_reverse() +
scale_color_brewer(palette = "Dark2") +
coord_fixed()
}