A convenience function to get just the areas of density polygons.
Usage
density_area(
  x,
  y,
  probs = 0.5,
  as_sf = FALSE,
  as_list = FALSE,
  range_mult = 0.25,
  rangex = NULL,
  rangey = NULL,
  ...
)
Arguments
- x, y
Numeric data dimensions
- probs
Probabilities to compute density polygons for
- as_sf
Should the returned values be sf::sf? Defaults to
FALSE.- as_list
Should the returned value be a list? Defaults to
TRUEto work well with tidyverse list columns- range_mult
A multiplier to the range of
xandyacross which the probability density will be estimated.- rangex, rangey
Custom ranges across
xandyranges across which the probability density will be estimated.- ...
Additional arguments to be passed to
ggdensity::get_hdr()
Value
A list of data frames, if as_list=TRUE, or just a data frame,
if as_list=FALSE.
Data frame output
If as_sf=FALSE, the data frame has the following columns:
- level_id
An integer id for each probability level
- prob
The probability level (originally passed to
probs)- area
The area of the HDR polygon
sf output
If as_sf=TRUE, the data frame has the following columns:
- level_id
An integer id for each probability level
- prob
The probability level (originally passed to
probs)- geometry
The
sf::st_polygon()of the HDR- area
The area of the HDR polygon
Details
If both rangex and rangey are defined, range_mult will be disregarded.
If only one or the other of rangex and rangey are defined, range_mult
will be used to produce the range of the undefined one.
Examples
library(densityarea)
library(dplyr)
#>
#> Attaching package: ‘dplyr’
#> The following objects are masked from ‘package:stats’:
#>
#>     filter, lag
#> The following objects are masked from ‘package:base’:
#>
#>     intersect, setdiff, setequal, union
library(sf)
#> Linking to GEOS 3.12.1, GDAL 3.8.4, PROJ 9.4.0; sf_use_s2() is TRUE

ggplot2_inst <- require(ggplot2)
#> Loading required package: ggplot2

# basic usage

set.seed(10)
x <- rnorm(100)
y <- rnorm(100)

density_area(x,
             y,
             probs = ppoints(50)) ->
  poly_areas_df

head(poly_areas_df)
#> # A tibble: 6 × 3
#> # Groups:   level_id [6]
#>   level_id  prob   area
#>      <int> <dbl>  <dbl>
#> 1        1  0.01 0.0759
#> 2        2  0.03 0.237
#> 3        3  0.05 0.373
#> 4        4  0.07 0.547
#> 5        5  0.09 0.703
#> 6        6  0.11 0.869

# Plotting the relationship between probability level and area
if(ggplot2_inst){
  ggplot(poly_areas_df,
         aes(prob, area)) +
    geom_line()
}


# Tidyverse usage

data(s01)

## Data preprocessing

s01 |>
  mutate(log_F2 = -log(F2),
         log_F1 = -log(F1)) ->
  s01

### Data frame output

s01 |>
  group_by(name) |>
  reframe(density_area(log_F2,
                       log_F1,
                       probs = ppoints(10))) ->
  s01_areas_df

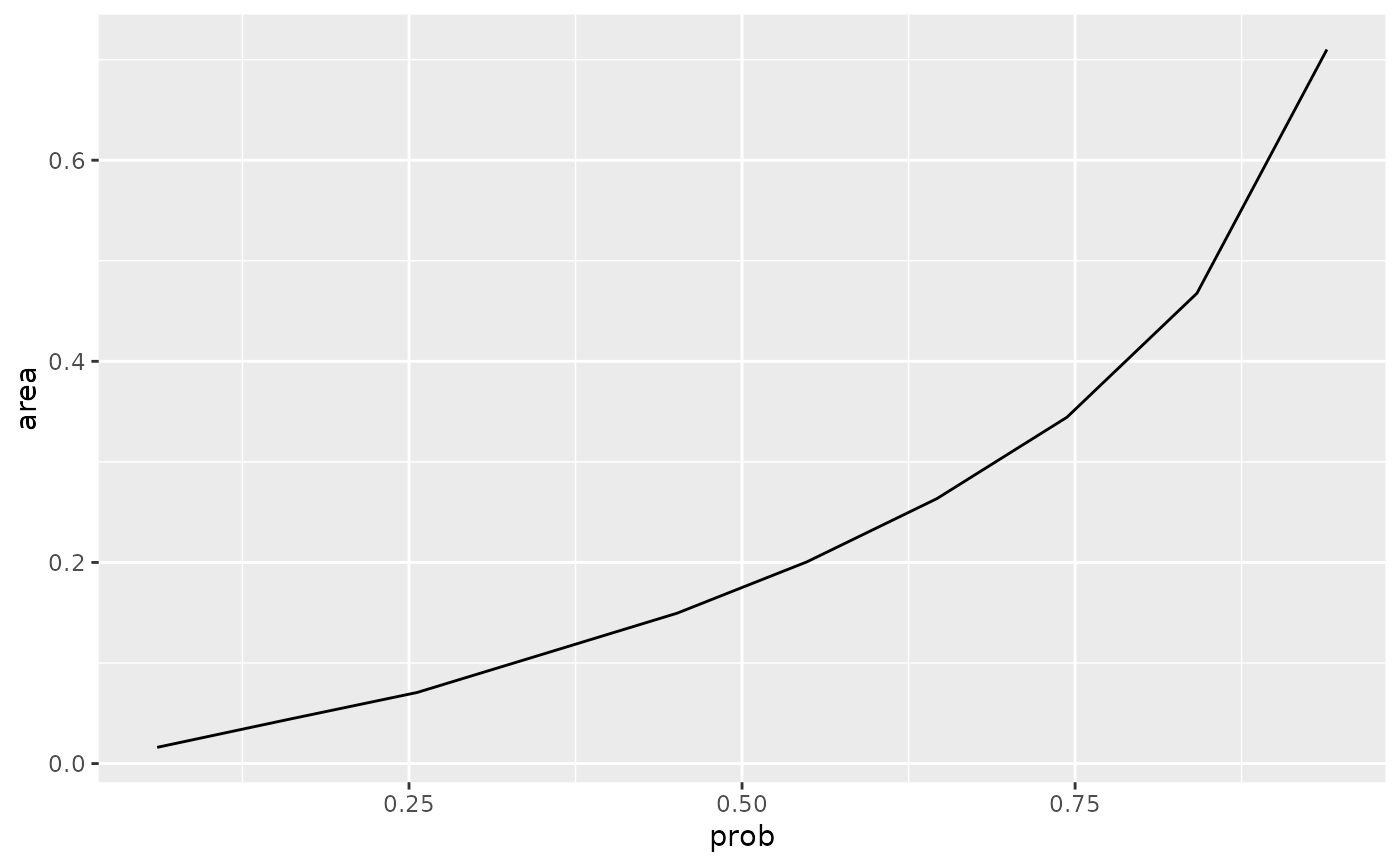
if(ggplot2_inst){
  s01_areas_df |>
    ggplot(aes(prob, area)) +
    geom_line()
}


### Including sf output

s01 |>
  group_by(name) |>
  reframe(density_area(log_F2,
                       log_F1,
                       probs = ppoints(10),
                       as_sf = TRUE)) |>
  st_sf() ->
  s01_areas_sf

if(ggplot2_inst){
  s01_areas_sf |>
    arrange(desc(prob)) |>
    ggplot() +
    geom_sf(aes(fill = area))
}
