Part 1
Given two ranges of numbers, we need to find how many ranges have a complete overlap.
── Attaching packages ─────────────────────────────────────── tidyverse 1.3.2 ──
✔ ggplot2 3.4.0      ✔ purrr   0.3.5
✔ tibble  3.1.8      ✔ dplyr   1.0.10
✔ tidyr   1.2.1      ✔ stringr 1.4.1
✔ readr   2.1.3      ✔ forcats 0.5.2
── Conflicts ────────────────────────────────────────── tidyverse_conflicts() ──
✖ dplyr::filter() masks stats::filter()
✖ dplyr::lag()    masks stats::lag()
<- read_csv ("2022-12-4_assets/input.txt" , col_names = FALSE )
Rows: 1000 Columns: 2
── Column specification ────────────────────────────────────────────────────────
Delimiter: ","
chr (2): X1, X2

ℹ Use `spec()` to retrieve the full column specification for this data.
ℹ Specify the column types or set `show_col_types = FALSE` to quiet this message.
<- |> separate (into = c ("elf1_start" , "elf1_end" ),convert = TRUE |> separate (into = c ("elf2_start" , "elf2_end" ),convert = TRUE
For two ranges of numbers, they overlap if
x1   .....   x2
   y1  .......  y2

x1 <= y2
y1 <= x2
<- |> filter (elf1_start <= elf2_end,<= elf1_end)
I think I have to use disjunction to find complete containment? Either
x1 .......... x2
   y1 ... y2

x1 <= y1 & x2 >= y2 || y1 <= x1 & y2 >= x2
|> filter ((elf1_start <= elf2_start & elf1_end >= elf2_end) | <= elf1_start & elf2_end >= elf1_end)) |> nrow ()
Part 2
Hah! Got the number of overlaps first!
Just for Fun
Loading required package: sysfonts
Loading required package: showtextdb
library (ggdark)library (scales)
Attaching package: 'scales'
The following object is masked from 'package:purrr':

    discard
The following object is masked from 'package:readr':

    col_factor
library (khroma)font_add_google (name = "Mountains of Christmas" , family = "christmas" )showtext_auto ()theme_set (dark_theme_gray () + theme (title = element_text (family = "christmas" , size = 20 )))
Inverted geom defaults of fill and color/colour.
To change them back, use invert_geom_defaults().
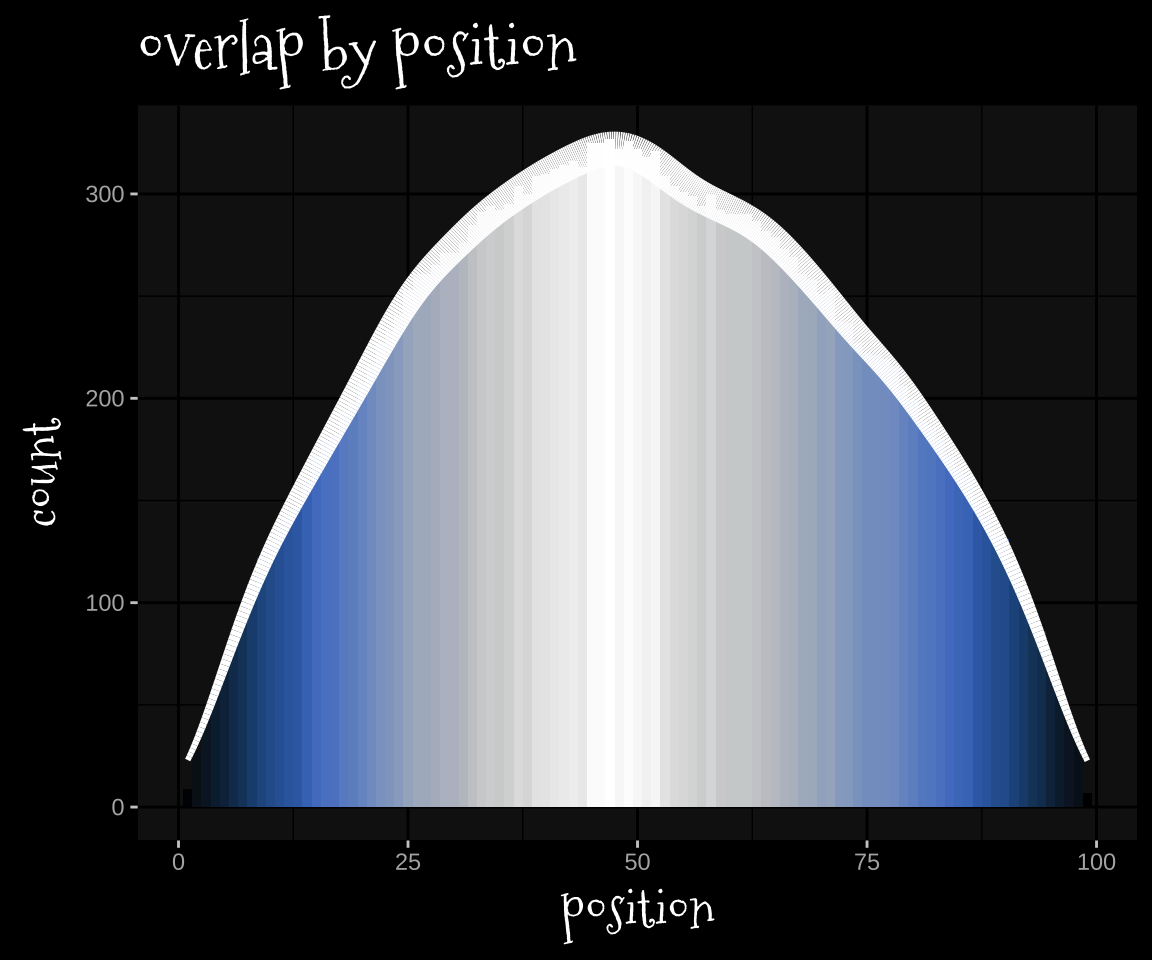
|> rowwise () |> mutate (overlap_start = max (c (elf1_start, elf2_start)),overlap_end = min (c (elf1_end, elf2_end)),overlap_df = map2 (overlap_start, overlap_end, ~ tibble (position = .x: .y))) |> select (overlap_df) |> unnest (overlap_df) |> ggplot (aes (position))+ stat_bin (binwidth = 1 ,aes (y = after_stat (count), fill = after_stat (count))) + stat_density (aes (y = after_stat (count),linewidth = after_stat (count)), geom = "path" )+ scale_fill_oslo (guide = "none" )+ scale_linewidth (guide = "none" )+ labs (title = "overlap by position" )