library(tidyverse)
library(ggdark)
library(khroma)
library(showtext)
library(scales)
library(ggfx)
font_add_google(name = "Mountains of Christmas",
                family = "christmas")
font_add(family = "Noto Emoji",
         regular = file.path(font_paths()[2],
                             "NotoEmoji-VariableFont_wght.ttf"))

showtext_auto()

theme_set(dark_theme_minimal(base_size = 12) +
           theme(title = element_text(family = "christmas",
                                      size = 20)))

knitr::knit_hooks$set(crop = knitr::hook_pdfcrop)Day 10
R
map()unnest()ggplot2
Part 1
Ok, it seems like the commands execute sequentially without overlap, so this should be pretty straight forward.
So I said the night of, but was having some kind of persistent off-by-1 errors somewhere. In the light of day I seem to have fixed it.
commands <- read_lines("2022-12-10_assets/input.txt")
example <- read_lines("2022-12-10_assets/sample.txt")
My approach is going to involve expanding out the cycle commands into a dataframe where I have a column of what value should be added at each cycle. I need functions to
- explicitly provide
noopwith the value 0, - return a vector of
c(0)fornoopand a vector ofc(0, X)foraddx.
expand_noop <- function(x){
  if(ncol(x) == 1){
    out <- c(x[1, ], "0")
  }else{
    out <- x[1, ]
  }
  return(out)
}

expand_command <- function(command, value){
  if(command == "noop"){
    out <- data.frame(add = 0)
  }else if(command == "addx"){
    out <- data.frame(add = c(0, as.numeric(value)))
  }
  return(out)
}
sample_commands <- c("noop", "addx 3", "addx -5")
map(sample_commands, ~str_split(.x, " ", simplify = T)) |>
map(~expand_noop(.x)) |>
reduce(rbind) |>
as_tibble(.name_repair = "universal") |>
mutate(command = 1:n()) |>
mutate(cycle_adds = map2(...1, ...2, expand_command)) |>
unnest(cycle_adds) |>
mutate(cycle = 1:n(),
# The add X event doesn't occur until
# *after* the cycle ends, so *during*
# the cycle, X is the cumulative sum
# lagged by 1
X_after = cumsum(add) + 1,
X = lag(X_after))# A tibble: 5 × 7
...1 ...2 command add cycle X_after X
<chr> <chr> <int> <dbl> <int> <dbl> <dbl>
1 noop 0 1 0 1 1 NA
2 addx 3 2 0 2 1 1
3 addx 3 2 3 3 4 1
4 addx -5 3 0 4 4 4
5 addx -5 3 -5 5 -1 4That worked like the small example said it should. Re-wrapping the code as a function:
cycle_compute <- function(commands){
  map(commands, ~str_split(.x, " ", simplify = T)) |>
  map(~expand_noop(.x)) |>
  reduce(rbind) |>
  as_tibble(.name_repair = "universal") |>
  mutate(command = 1:n()) |>
  mutate(cycle_adds = map2(...1, ...2, expand_command)) |>
  unnest(cycle_adds) |>
  mutate(cycle = 1:n(),
         X_during= cumsum(add) + 1,
         X = lag(X_during),
         strength = X * cycle)->out
  return(out)
}
Comparing the function against the bigger example (cause this was giving me such big problems earlier)
example_results <- c(420, 1140, 1800, 2940, 2880, 3960)
cycle_compute(example) |>
  slice(c(20, 60, 100, 140, 180, 220)) |>
  mutate(answers = example_results)|>
  select(strength, answers)
# A tibble: 6 × 2
strength answers
<dbl> <dbl>
1 420 420
2 1140 1140
3 1800 1800
4 2940 2940
5 2880 2880
6 3960 3960That also worked correctly. Here we go on the actual commands.
cycle_info <- cycle_compute(commands)
cycle_info |>
  slice(c(20, 60, 100, 140, 180, 220)) |>
  summarise(strength = sum(strength))
# A tibble: 1 × 1
strength
<dbl>
1 14340Part 2
Step 1: Set up the rows & pixels
cycle_info |>
  mutate(pixel = rep(0:39, n()/40),
         row = rep(1:(n()/40), each = 40),
         X = replace_na(X, 1),
         strength = replace_na(strength, 1)) -> cycle_info
I think drawing should just be whether X-1 <= pixel <= X+1?
For fun, I’m going to add an outer glow to the tile with the ggfx package.
cycle_info |>
  mutate(draw = (X-1) <= pixel & pixel <= (X+1)) |>
  filter(draw) |>
  ggplot(aes(pixel, row))+
    with_outer_glow(
      geom_tile(fill = "white"),
      colour = "green",
      expand = 3
    )+
    scale_y_reverse()+
    coord_fixed()+
    dark_theme_void()
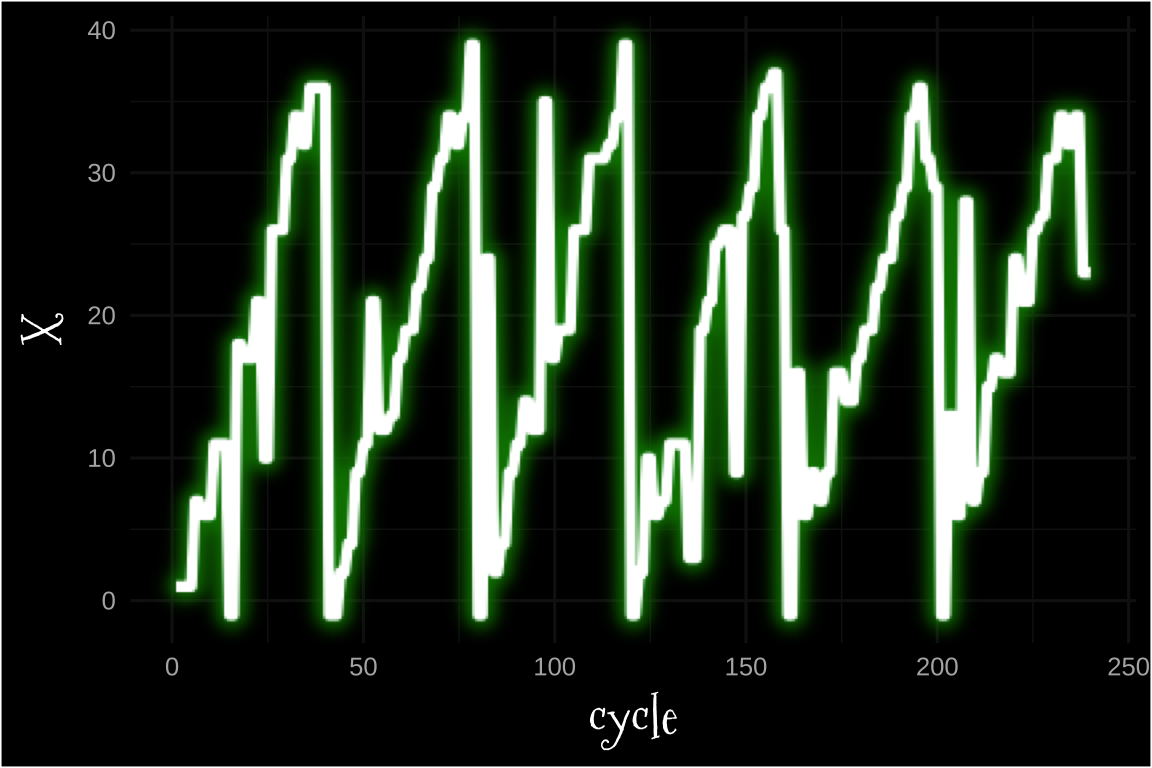
Just for Fun
cycle_info |>
  ggplot(aes(cycle, X))+
    with_outer_glow(
      geom_line(linewidth = 2),
      colour = "green",
      expand = 3
    )