The Elves take turns writing down the number of Calories contained by the various meals, snacks, rations, etc. that they’ve brought with them, one item per line. Each Elf separates their own inventory from the previous Elf’s inventory (if any) by a blank line.
For example, suppose the Elves finish writing their items’ Calories and end up with the following list:
This list represents the Calories of the food carried by five Elves:
The first Elf is carrying food with 1000, 2000, and 3000 Calories, a total of 6000 Calories.
The second Elf is carrying one food item with 4000 Calories.
The third Elf is carrying food with 5000 and 6000 Calories, a total of 11000 Calories.
The fourth Elf is carrying food with 7000, 8000, and 9000 Calories, a total of 24000 Calories.
The fifth Elf is carrying one food item with 10000 Calories.
In case the Elves get hungry and need extra snacks, they need to know which Elf to ask: they’d like to know how many Calories are being carried by the Elf carrying the most Calories. In the example above, this is 24000 (carried by the fourth Elf).
Find the Elf carrying the most Calories. How many total Calories is that Elf carrying?
R Session Info
sessionInfo()
R version 4.2.1 (2022-06-23)
Platform: aarch64-apple-darwin20 (64-bit)
Running under: macOS Monterey 12.3

Matrix products: default
BLAS:   /Library/Frameworks/R.framework/Versions/4.2-arm64/Resources/lib/libRblas.0.dylib
LAPACK: /Library/Frameworks/R.framework/Versions/4.2-arm64/Resources/lib/libRlapack.dylib

locale:
[1] en_US.UTF-8/en_US.UTF-8/en_US.UTF-8/C/en_US.UTF-8/en_US.UTF-8

attached base packages:
[1] stats     graphics  grDevices datasets  utils     methods   base

loaded via a namespace (and not attached):
 [1] digest_0.6.30     jsonlite_1.8.3    magrittr_2.0.3    evaluate_0.17
 [5] rlang_1.0.6       stringi_1.7.8     cli_3.4.1         renv_0.15.5
 [9] rstudioapi_0.14   rmarkdown_2.17    tools_4.2.1       stringr_1.4.1
[13] htmlwidgets_1.5.4 xfun_0.34         yaml_2.3.6        fastmap_1.1.0
[17] compiler_4.2.1    htmltools_0.5.3   knitr_1.40
Rows: 2223 Columns: 1
── Column specification ────────────────────────────────────────────────────────
Delimiter: ","
dbl (1): X1

ℹ Use `spec()` to retrieve the full column specification for this data.
ℹ Specify the column types or set `show_col_types = FALSE` to quiet this message.
I’ll identify the rows with NA and fill them with the row index. Then fill downward. I’ll need a special rule for the first row.
calories |>## a unique id for each elf.## won't increment by 1, but will be uniquemutate(row_idx =1:n(),elf_id =case_when(is.na(X1) ~ row_idx, row_idx ==1~ row_idx ) ) |>## fill in the elf id for all rowsfill(elf_id) |>## drop na values for summarisingdrop_na() |>## group_by, summarise, arrangegroup_by(elf_id) |>summarise(total_calories =sum(X1)) |>arrange(desc(total_calories)) |>## pull the top number slice(1) |>pull(total_calories)
[1] 70764
Part 2
Same as before, but now the sum of the top three. Maybe I should’ve done some intermediate assignment, but oh well, here’s the block again, this time with the first three.
calories |>## a unique id for each elf.## won't increment by 1, but will be uniquemutate(row_idx =1:n(),elf_id =case_when(is.na(X1) ~ row_idx, row_idx ==1~ row_idx ) ) |>## fill in the elf id for all rowsfill(elf_id) |>## drop na values for summarisingdrop_na() |>## group_by, summarise, arrangegroup_by(elf_id) |>summarise(total_calories =sum(X1)) |>arrange(desc(total_calories)) |>## pull the top threeslice(1:3) |>pull(total_calories) |>## sum upsum()
[1] 203905
Just for fun
library(showtext)
Loading required package: sysfonts
Loading required package: showtextdb
library(ggdark)library(scales)
Attaching package: 'scales'
The following object is masked from 'package:purrr':

    discard
The following object is masked from 'package:readr':

    col_factor
library(khroma)font_add_google(name ="Mountains of Christmas", family ="christmas")showtext_auto()
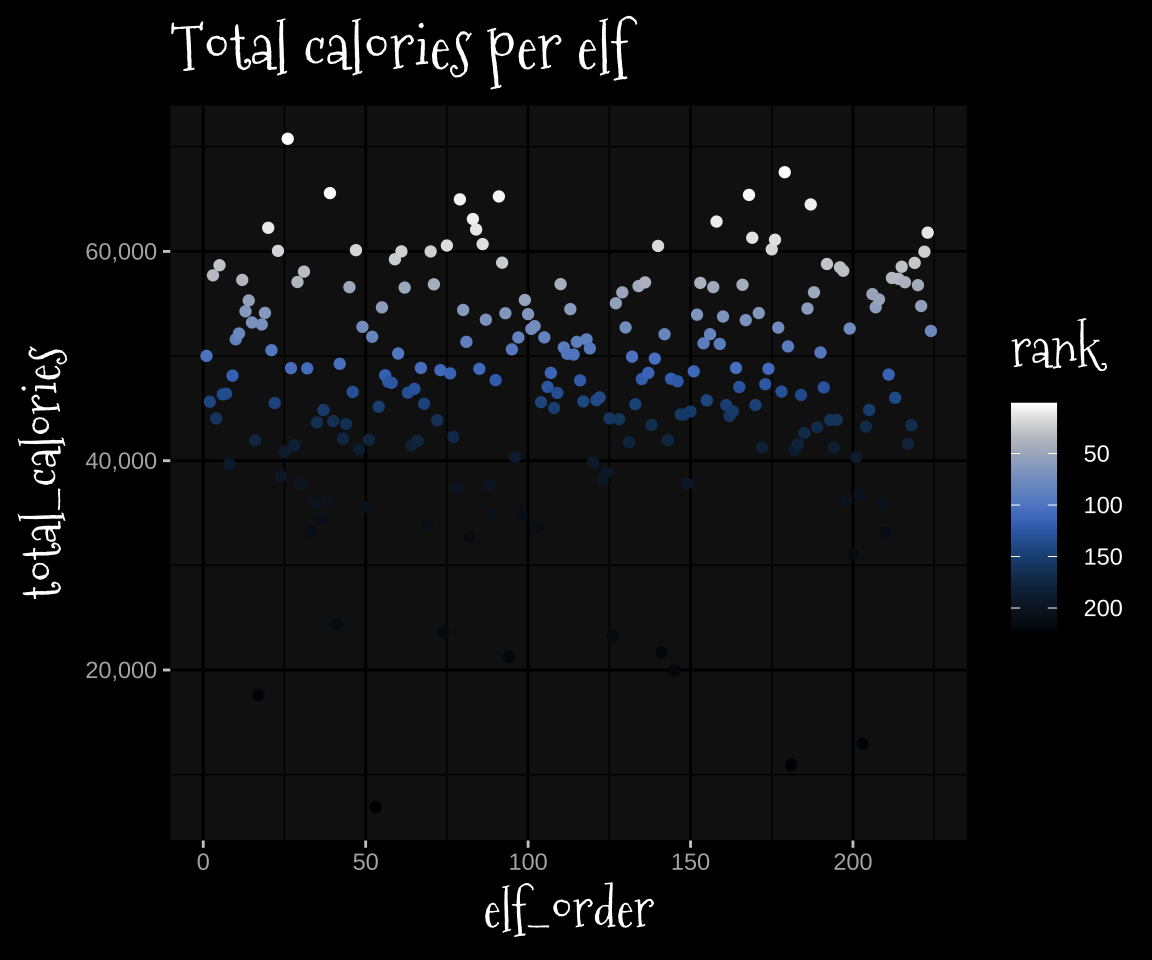
total_calories <- calories |>## a unique id for each elf.## won't increment by 1, but will be uniquemutate(row_idx =1:n(),elf_id =case_when(is.na(X1) ~ row_idx, row_idx ==1~ row_idx ) ) |>## fill in the elf id for all rowsfill(elf_id) |>## drop na values for summarisingdrop_na() |>## group_by, summarise, arrangegroup_by(elf_id) |>summarise(total_calories =sum(X1)) |>arrange(desc(total_calories)) |>mutate(rank =1:n())